I first became interested in assessment because I believed in what it could do. I believed it could help educators, administrators, and policymakers better design and target instruction, which can result in better learning experiences for students. But I also know that any assessment requires time and energy that could be devoted to something else.
When I was a teacher, I was always aware of the fact that the time I spent grading could have been devoted to lesson planning. The time my students spent taking a quiz could have been devoted to one of my endlessly engaging activities.
The perpetual balancing act of teaching and assessing led me to a golden rule: all assessment needs to pay for itself by increasing student learning. If I gave a one-hour quiz, I decided, I needed to then use that data to make students’ learning time at least one hour better. Most often this took the form of using the assessment results to identify content that needed more attention and moving past skills over which they had demonstrated mastery. In either case, I wanted to be sure my students were learning more or were being more appropriately challenged because of an assessment. As educators, we owe it to our students to squeeze 100% of the possible benefit out of the assessment data we get.
Guidance for using MAP Growth data
For the last 15 years, I’ve worked to help schools get the maximum benefit out of their assessments. A classroom vocabulary quiz and a college readiness exam, to name just two examples, have no value unless they can inform an educator’s lesson planning and help make students’ learning experience better.
When I came to NWEA, one of the first things I wanted to do was develop guidelines for how, when, and where MAP® Growth™ data could contribute to advanced learning placement decisions. Who should be placed in a gifted and talented service? Who is ready for Algebra 1 in seventh grade? Which students would benefit from starting kindergarten early? These are all questions that MAP Growth data can help answer and for which we at NWEA have developed some guidelines to help support partner schools and districts.
Placement decisions for any kind of selective program are always challenging and controversial. Inevitably, some students will be missed, the process often requires a lot of time and energy, and increasingly, there are concerns about equity and fairness. We developed our new guidance document with four criteria in mind: cost, alignment, sensitivity, and access.
- Cost: Use no more resources (i.e., time and/or money) than necessary
- Alignment: Be aligned in content, domain, and level with the services into which students will be placed
- Sensitivity: Correctly catch students who would benefit from the service
- Access: Remove any implicit or explicit barriers that are unrelated to need for or success in the service
In sum, effective placement criteria should catch all the students who would benefit from a particular opportunity, avoid considering factors that are irrelevant to readiness or success, and do so all while balancing cost with sensitivity.
MAP Growth can be used for both phases of program placement identification
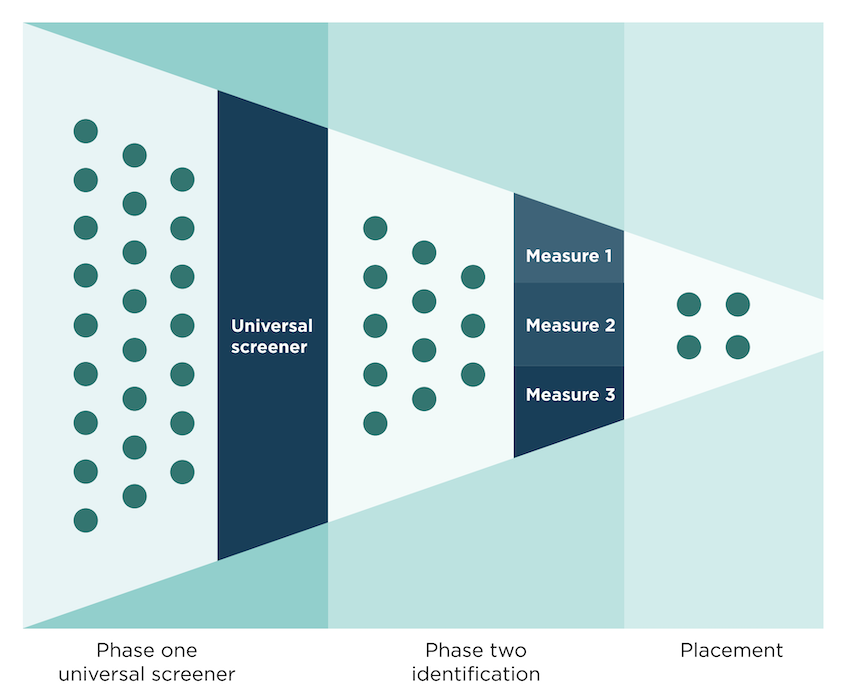
Program placement decisions, like gifted and talented student identification, often proceed in two phases. In the first phase, all students are screened, and those who meet some predetermined criteria are given further consideration at phase two. In phase two, multiple data points are collected to make decisions about program placement. MAP Growth can play a role in both phases.

MAP Growth as a universal screener
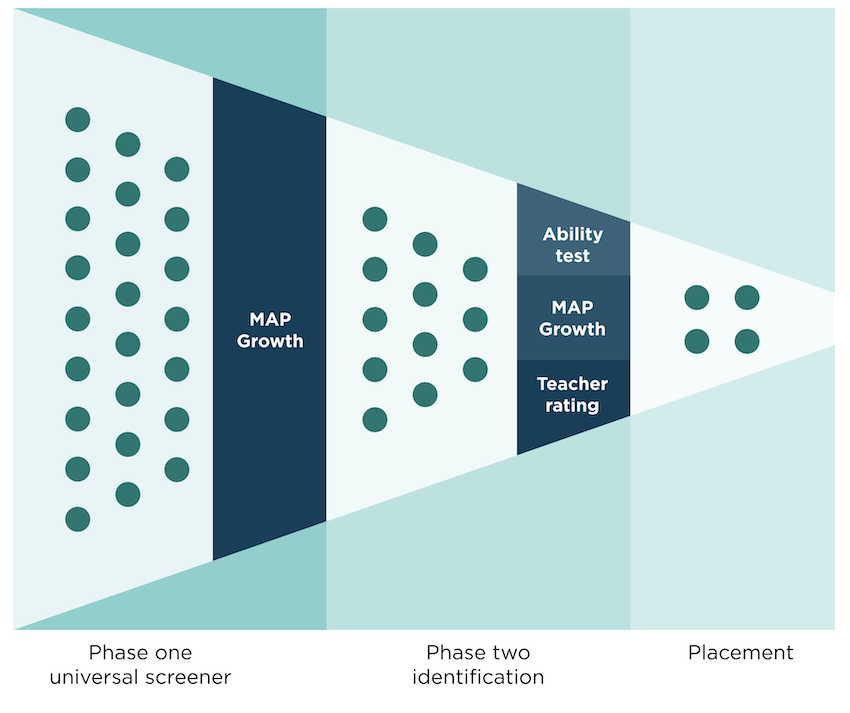
MAP Growth can work great as a phase one universal screener because it’s most often already administered to all students. Performance on MAP Growth is also often strongly correlated with performance on the actual identification criteria, which are part of phase two.
Consider a case where a school wants to use three data points at phase two to make gifted and talented identification decisions: ability test scores, MAP Growth scores, and some form of teacher rating or recommendation.

The district could collect all three data points from all students in a grade and then use that data to make placement decisions. That would provide the greatest access and sensitivity, but it would also come at an extremely high cost of time and money. Instead, schools could collect the ability and teacher rating scale data only for students who perform at a certain level on MAP Growth. (How to determine the specific level and on which MAP Growth test is a topic I address in the full guidance document.) A well-designed system like this can provide students with universal access and achieve the same system sensitivity and alignment at far less cost than collecting all data from all students.
What’s more is that most schools don’t start from a place of collecting the three data points from all students. More often, some or all data is only collected from students who are referred or nominated by a teacher or parent. This is problematic for access, sensitivity, and alignment. The students who are referred will not necessarily be the same ones who will do well at phase two and go on to do well in the program. They will also likely not represent the diversity of the overall student population, as shown by various studies (see the 2016 article by Jason Grissom and Christopher Redding, the 2010 article by Del Siegle et al., and the 2006 article by Matthew McBee). By using MAP Growth as a universal screener in place of a subjective referral at phase one, schools can provide greater access, achieve higher sensitivity and alignment, and even reduce costs, since there is no need to solicit or collect time-consuming referrals. As outlined in greater detail in the full document, phase one is really where MAP Growth can shine, especially when it comes to decreasing costs and removing the influence of implicit bias (documented by the researchers I mentioned above) that can be a barrier for access.
MAP Growth as one of multiple data points
The other place where MAP Growth can play a role is as one of multiple data points at phase two of making placement decisions. At this phase of the process, the goal is to measure the skills, abilities, and dispositions that are necessary for success in a program. Put another way, we want phase two to tell us which students are ready for and would benefit from something different, such as seventh-grade Algebra 1.
In some cases, MAP Growth measures the essential skills needed for success. For example, the MAP Growth 6+ math test includes a wide range of questions aligned to expressions and algebraic thinking and functions to model relationships (e.g., Common Core standard HSA.CD.A.1: “Create equations and inequalities in one variable and use them to solve problems”). If a school decides that these skills and other similar content measured by MAP Growth’s 6+ math test are a relevant predictor of which students might benefit from early algebra, then including MAP Growth scores at phase two makes sense.
Could a school develop its own assessment to measure these same skills and for the same purpose? Absolutely, and I have seen schools do this successfully. But it will take more student time to take these assessments and more teacher time to score them, plus such an approach inserts more opportunities for assessment error and bias, which harms sensitivity. If MAP Growth scores can provide similar information, the result is a less-costly process for everyone involved.
It’s not always easy to know which data points to use when making placement decisions or how high on those data points students need to score. Should students be able to read at an advanced level to take ninth-grade biology in eighth grade? Do students need to outscore an end-of-year first-grader in math and reading before they can be considered for early entrance to kindergarten? The answer to these types of questions should always come down to the concept of alignment. What does a student need to have scored, demonstrated, or mastered to be successful? If a student must be able to read “on grade level” for a ninth-grader to benefit from high school biology, then that should be a criterion for placement and included at phase two. (Note that the essential question should be, do we prevent ninth-graders from taking biology if they’re not reading at grade level? If not, why would we restrict an eighth-grader on that basis?) MAP Growth and NWEA linking studies can be especially useful here if the goal is knowing how a student’s current level of achievement compares to other students’ in higher grades.
Get the most from MAP Growth
We at NWEA want you to get as much benefit out of MAP Growth as possible. Finding ways to use MAP Growth to make advanced learning placement decisions is a perfect example. Check out the full guidance document and watch our webinar to learn more.


