Let’s consider a day in the life of a language arts teacher we’ll call Ms. Harper. In Ms. Harper’s classroom, for at least a half hour every week, her students use MAP® Reading Fluency™ with Coach to get personalized reading instruction. The kids sit down with their tablets, log on, and say hello to Maya, their AI-powered reading tutor.
In previous articles, I shared how Maya works behind the scenes to help students along their literacy journey, listening to them read, noticing errors, and providing scaffolded reading instruction at the word, phrase, and story level. MAP Reading Fluency with Coach helps each student get the reading practice that’s right for them, but it’s up to Ms. Harper to keep a close eye on their progress and adapt her instruction accordingly. How can she be sure she knows where each student stands, how they’re growing over time, and how they’re doing relative to their peers at school and across the county?
To help Ms. Harper answer these and other questions, NWEA built robust reports into MAP Reading Fluency with Coach that make large amounts of data accessible, revealing trends, successes, and red flags. These reports fall under two categories: MAP Reading Fluency assessment reporting and specific Coach reports. Taken together, these reports offer insights into performance and progress at the student, class, grade, school, and district levels.
Today I’d like to look at the Coach reports specifically. By looking at how Ms. Harper uses these reports to answer her own questions, I hope to help you get the most out of these reports so you know how to turn those data-driven insights into your own actionable classroom strategies. It all starts with asking the right questions.
Are my students on track with their tutoring progress?
Ms. Harper’s first point of reference is the Tracking report, which is updated weekly and enables at-a-glance management of the tutoring process. Big picture, she can see how many minutes each student has spent on practice in a given week, so she’ll know right away if her students are meeting the 30-minute recommendation from NWEA. Red, yellow, and green color-coding makes it easy to spot who’s on track and who might be falling behind. But Ms. Harper can also dig deeper and find a number of other details, including:
- Stories read this week. As the name suggests, this tells Ms. Harper how many stories her students have read this week. A dark red “scaffolding” icon next to a student’s name indicates that they’ve been assigned to Early Reader Skills Scaffold practice, while a lighter red icon indicates assignment to bilingual practice. Ms. Harper can easily drill down for a more detailed view of each story her students have read.
- Assessment status. This feature shows the status of each student’s most recent MAP Reading Fluency assessment, including the date of completion. If Ms. Harper sees “unassessed” next to any student’s name, she can assign assessments within the MAP Reading Fluency platform.
- Language. Ms. Harper can assign English only or bilingual practice.
How are my students progressing over time?
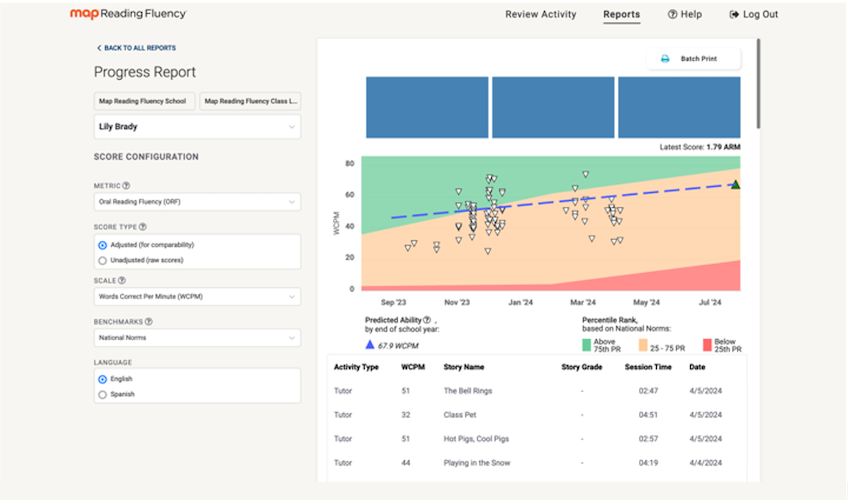
With the Progress report, Ms. Harper can see not only each student’s performance over time but also a future projection of expected performance tied to key metrics. Each practice session is visible as an individual data point, while a dashed blue line represents each student’s overall trajectory, allowing Ms. Harper to analyze her students’ performance, track their growth, and set ambitious but realistic goals. A handy “score configuration” sidebar lets her change the display for different metrics, score types, scales, and benchmarking norms.

Below each student’s progress graph, there’s a table listing up to 600 activities completed in MAP Reading Fluency with Coach in the current school year. Ms. Harper can click through to view the data for any one of these reading activities—and she can even listen to a student’s recording and rescore the reading if appropriate. Maya is a smart observer, but Ms. Harper gets to make the final call.
The Progress report is also where Ms. Harper can find her students’ percentile rank, based on national norms, with their practice session scores shown against a backdrop of green (75th percentile and above), yellow (25–75th percentile), or red (below 25th percentile).
How is my whole class doing with the various reading skills?
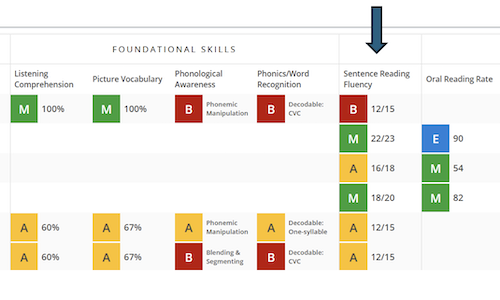
To see the status of her entire class in every reading skill, Ms. Harper consults the Skills Status report. Each student has a color-coded box for each reading skill that shows their mastery level (green = mastered, yellow = developing, red = not developed). Essentially, this report takes all the data Coach gathers on students while they read and hands it directly to the user. The report is informed by Hollis Scarborough’s Strand Model of Skilled Reading (a.k.a. the Reading Rope) and organized into strands, including decoding, phonological awareness, high-frequency words, background knowledge, and vocabulary.
Ms. Harper can interact with the report to find exactly the level of detail she needs. For example, she can click on the “decoding” strand and then hover over a particular skill box, where she’ll find a description of the skill, a tally of the number of times a student has encountered this skill, and the number of errors they’ve made. Drilling further down, Ms. Harper can view instructional resource recommendations for each skill. She can also drag and drop to organize students into helpful orders, such as their assigned reading groups.
OK, but how can I see skill data for each student?
While the Skills Status report gives Ms. Harper a whole-class view of reading skill achievement and progress, she can use the Skills Diagnostic report to look at a student’s mastery holistically, through the prism of time. Like the Skills Status report, this report is informed by Scarborough’s Reading Rope. It shows the learning progression ordered by skill area. Skill areas are ordered by their typical age of acquisition and are arranged in time, on a continuum from kindergarten to fifth grade. Essentially, the report shows when a student “ought” to acquire skills during their journey to reading mastery.
As Ms. Harper moves her mouse over the different skills, information about each skill appears in a flyover box to provide more context. The red-yellow-green color system represents a student’s familiarity and proficiency with specific skills, taking into consideration two main factors: number of exposures to the skill, which refers to how many times a student has encountered or practiced a particular skill; and error rate percentage, which is determined by the observations made by Coach. Importantly, clicking on each skill produces a pop-up window where Ms. Harper can drill down into the subskills to view aligned resource recommendations.
Last but not least, how can I celebrate my students’ milestones and keep track of them?
As her students travel further down their own individualized reading paths, Ms. Harper wants to make sure that their victories and hard work get the recognition they deserve. But with so many students working on their own skills in their own practice sessions, it’s a lot to keep track of. That’s where the Badging report comes in.

Like the Tracking report, the Badging report displays the number of stories read and the total reading minutes for each student in the selected week. Ms. Harper can also see a class total of the minutes and stories read for each week. There are five ways for students to earn badges automatically with Coach, and Ms. Harper can also create her own badges and certificates in addition to the following:
- Total Sessions
- Minutes This Week
- New WCPM Highs
- Skills Scaffold Graduation (Early Reader)
- Fluency Milestone Achieved
While the Badging report generates printable awards and certificates based on students’ tracking data, Ms. Harper has to approve these badges first so she maintains control over the process.
In closing
Taken together, the reports I’ve described here help teachers answer the perennial question: How do I adapt my lesson plans in light of all the data I’m seeing on my students?
There are certainly a lot of instructional implications in these reports—and with the granular level of detail they contain, you not only gain specific insights into how your students are doing but also receive valuable guidance about what your students need next. And to make sure you get the support you need along the way, you can click over to the MAP Reading Fluency with Coach Help Center any time you need tips for understanding the reports and using them to their full potential.


