
 If you’ve ever taken a child to the doctor’s office for a routine visit, you know that measuring the child’s height and weight is standard procedure. And you might have noticed that it’s not the inches and pounds themselves that are most interesting, rather, it’s the context: how these numbers have changed over time and how the child’s height and weight compare to those of their peers.
When it comes to academic test performance, NWEA takes a similar view. It’s all about context. While a student’s score on an interim assessment like MAP® Growth™ is an important data point, the real value comes in knowing how that student is growing over time. That’s the insight teachers need to know how best to support their students on their individual learning journeys.
With student growth in mind, NWEA built MAP Growth on the RIT scale—a measurement scale designed to provide stability and trustworthy insights from season to season and year to year. The RIT scale:
- Measures achievement and growth independent of a student’s age or grade, providing a common language for discussing student learning across schools and districts
- Gives educators the consistent information they need to support every student, whether they’re working on, above, or below grade level
- Allows educators to track student growth from year to year and across a student’s entire learning journey
In this article, we’ll look under the hood of the RIT scale and see how it works in practice.
Five fast facts about the RIT scale
Let’s begin with five facts about the RIT scale:
- “RIT” stands for Rasch UnIT and was named after Georg William Rasch, a Danish mathematician, statistician, and psychometrician.
- The RIT scale ranges from 100 to 350 and helps educators track growth across a student’s entire educational career.
- The RIT scale is an equal-interval scale, which means it measures student learning equally across the entire scale. The amount of learning growth that occurs between 150 and 151 RIT, for example, is the same amount of learning that occurs between 250 and 251 RIT.
- The RIT scale is grade-level independent, which means that it measures achievement and growth in a manner that is not informed or biased by a student’s age or grade. As a result, all students of all ages with all kinds of RIT scores can be compared using the same RIT scale.
- The RIT scale measures both students and test items on the same scale, from lower achievement to higher achievement (students) and less difficulty to more difficulty (test items).
Unpacking “equal-interval”
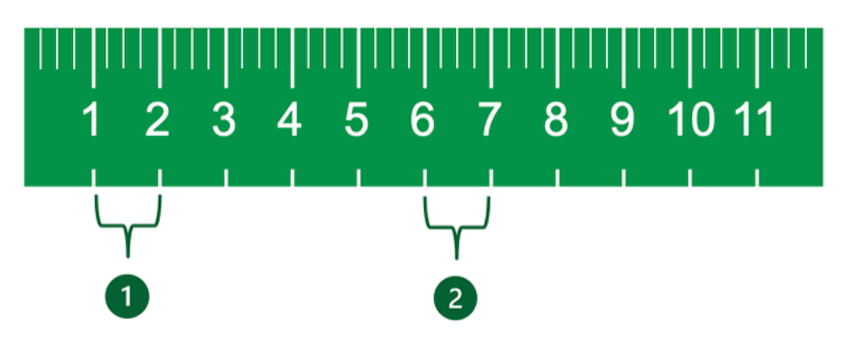
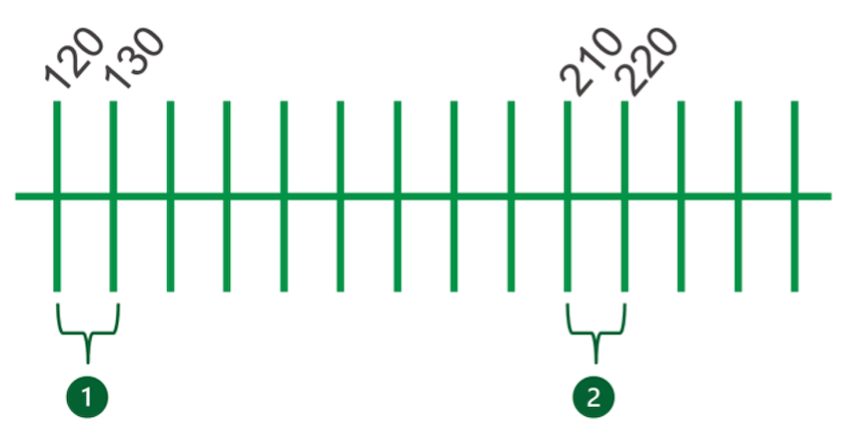
Now let’s take a closer look at the equal-interval aspect of the RIT scale. Again, equal interval means that the difference between the scores is the same regardless of whether the student is at the top, middle, or bottom of the RIT scale. Consider the illustration below. Just as the difference between one and two inches on a ruler represents the same distance as the difference between six and seven inches…
 …the difference between 120 and 130 on the RIT scale represents the same growth as the difference between 210 and 220.
 If a student’s RIT score changes over time, you can be sure that the academic growth of that individual student is the only factor influencing the score. A student can change grades, schools, districts, or even states, and their RIT score will mean the same thing no matter where they are. No one is “moving the goalposts” with MAP Growth scores, so the RIT score remains highly dependable and illuminating.
How do students get their RIT score?
Let’s take a student who’s new to MAP Growth. We’ll call him Javier.
When Javier and his classmates first sit down to take the MAP Growth assessment, the test looks the same to all of them, but their experiences soon diverge. From the first test item, the system begins adjusting, giving Javier progressively harder items to see where the edge of his achievement level is. The test is trying to identify the sweet spot where Javier is equally likely to get an item right as wrong.
As the difficulty of test items continues to adjust up or down based on each student’s performance, Javier and his friends increasingly see their own unique version of the test. These slight adjustments continue, turning in an easier direction following a wrong answer and a more challenging direction following a correct one. This is what makes MAP Growth such an efficient and useful assessment; the test isn’t wasting time on items that are far too easy or far too hard for the kids taking it.
And here’s where the RIT score comes in. Throughout the assessment process, the brain behind MAP Growth is looking for an answer to one overarching question: What is the difficulty level of questions that Javier answers correctly about 50% of the time?
I mentioned earlier that RIT scores apply to test items as well as students. As an example, take a RIT score of 200. A student with this score answers 50% of items at this level of difficulty correctly, and a test item with this score is answered correctly by 50% of students at this achievement level. By examining this 50% sweet spot, we can find the edge of each student’s ability, which tells us much more about growth than simply looking at all the questions students got right and the ones they got wrong.
A final note about how students get their RIT score: It’s not just about number crunching. Student engagement is a key part of the process. We need Javier’s full, active participation in MAP Growth to feel confident in the accuracy of the score. That’s why the test is designed to check for any signs of disengagement, such as rapid guessing, in which case the test will flag the issue and give the student a friendly reminder to slow down.
How do teachers use RIT scores?
There’s strength in numbers. Teachers can use a student’s RIT score to advance a whole range of instructional and planning activities, including the following:
- Identifying common opportunity areas across an entire class
- Providing a starting point for high-quality formative assessment
- Informing instructional planning
- Helping to guide decisions about appropriate scaffolding strategies
- Tracking longitudinal growth over a student’s entire academic career
- Setting growth goals with students
- Connecting to instructional resources aligned to student RIT scores
Learn more
Want to learn more about RIT scores? Here are a few steps you can take to advance your knowledge:
- Watch MAP Growth: RIT 101, an explainer video by NWEA researcher Karyn Lewis
- Put RIT scores to their optimal use with the MAP Growth Goal Explorer
- Learn more about how NWEA uses normative data and RIT scores