If you happen to have read our post back in early August about the newly updated Class Profile report, you’ll know that MAP® Growth™ reports are all centered around one thing: you. Your input as an educator helps us create and build them all, including the full suite of profile reports—the Student, Class, School, and now the MAP Growth District Profile report—which transforms all your raw assessment data into essential information for making crucial decisions.
Stepping back, looking deeper
One of the main asks we have heard from administrators is for a customizable report that provides essential, accurate information for making big district decisions. With the new MAP Growth District Profile report, you can:
- Have a holistic view of your district’s academic standing and can easily track achievement and growth from the district level down to individual grades within each school
- Make informed, district-wide decisions about where to allocate resources and make strategic changes by comparing district performance to national norms and filtering data by gender, ethnicity, program, or subject
- Customize endlessly and see exactly what’s most helpful to you with the ability to instantly sort large amounts of data and rely on real-time results
What does all this look like? Let’s take a quick spin through the two main screens of the report. The views are similar but the data they show is very different.
Single-term achievement view
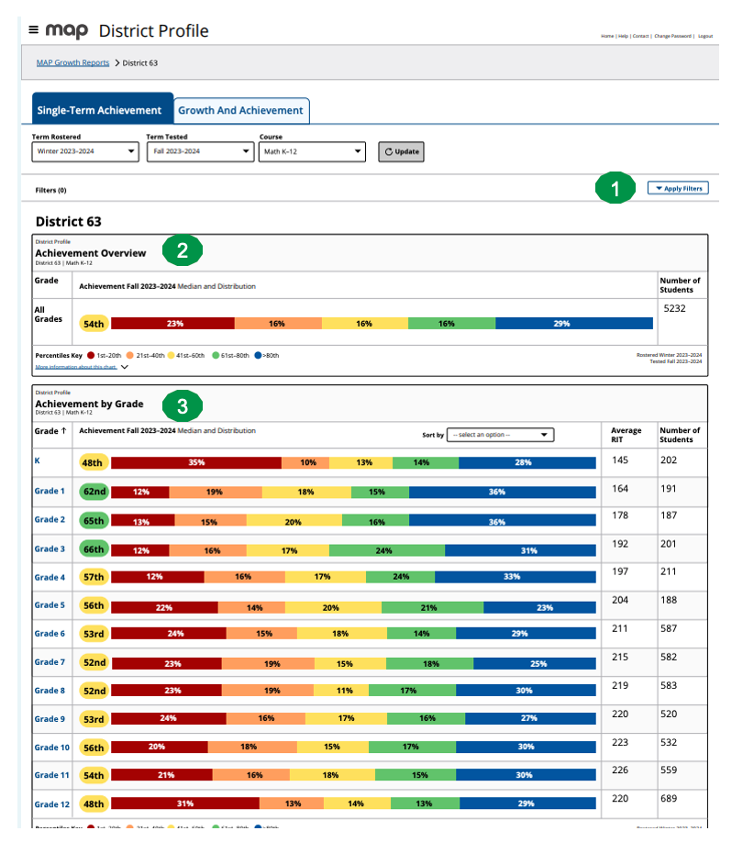
The single-term achievement view of the MAP Growth District Profile report shows your district’s MAP Growth achievement in one term.

- Here’s your customization. You can see and address the needs of diverse student groups across your district by filtering for gender, ethnicity, program, or subject.
- These are your district results, where you can see how student scores in your district compare to other same-grade students across the US.
- Here’s where you can see grade-specific achievement percentiles and compare student scores with peers in the same grades nationwide.
Most importantly, you can now answer the following questions:
- Which schools need the most support in each grade?
- Which schools are excelling in each grade?
- What differences exist when examining performance in a subject by ethnicity, gender, or program?
- Are there trends in achievement at the district or grade-level year after year or between terms?
- Is one grade performing better in some courses than others (e.g., math vs. reading)?
Growth and achievement view
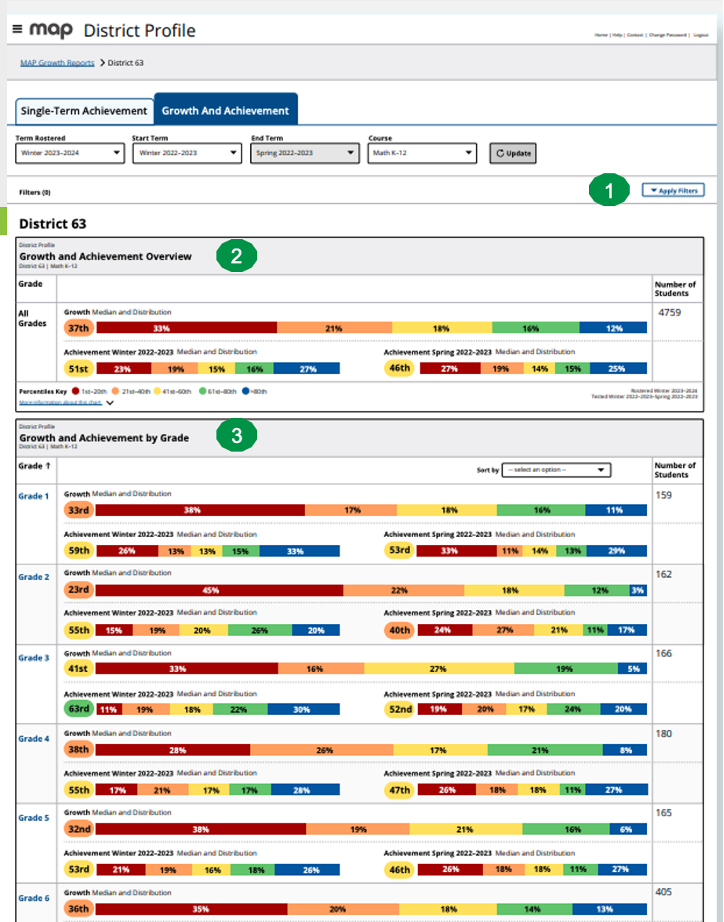
With the growth and achievement view of the MAP Growth District Profile report, you can track your district’s achievement over time. This is where you can really dig in and start to answer those resourcing decisions.

Just like with the single-term achievement view, here you can filter to see results from different groups of students.
- Here you can review results across multiple testing events to see both growth and achievement at the district level.
- This is where you can look into grade-level growth for individual schools and courses and support MTSS programs across your district.
There are many important questions you can now answer:
- How is your district doing overall?
- How much are students growing compared to similar students in the NWEA norm group?
- What was the impact of a major change (for example, additional intervention resources or a new curriculum) that was made last year? Did it result in any positive change at the district or grade level?
- What are the higher/lower achieving grades or schools in your district?
Knowledge is power
The MAP Growth District Profile report is a valuable resource for understanding how all the kids in your district are doing. When combined with the Student, Class, and School profile reports, it becomes even easier to analyze assessment data at every level, from the amazing achievement of one second-grader to the trends of thousands of K–12 students.


