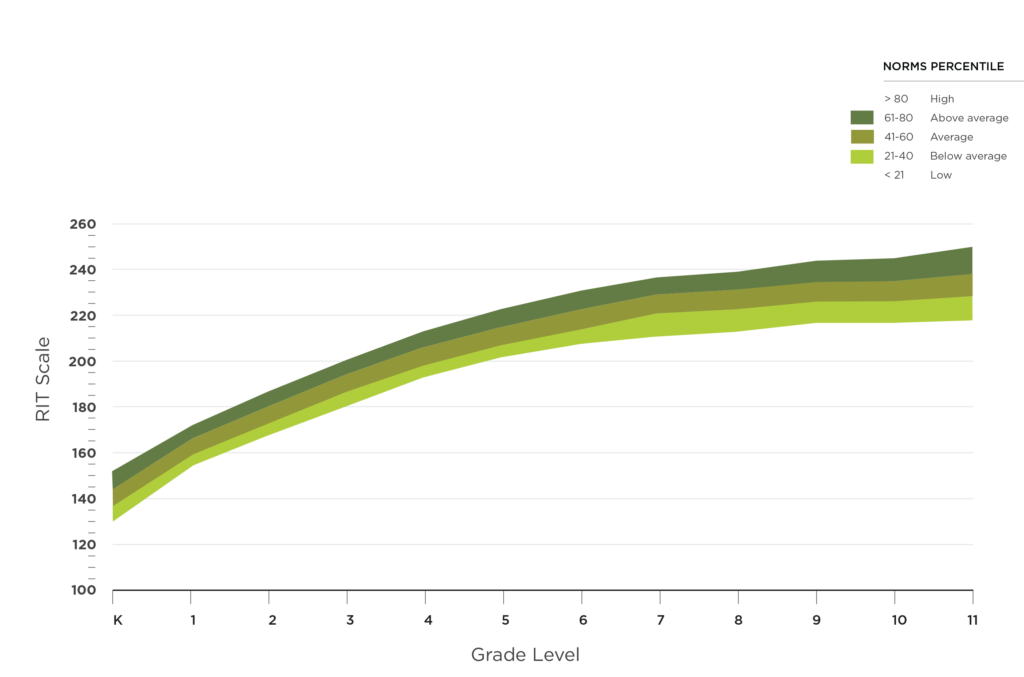
Normative Data & RIT Scores
The most accurate norms
Today’s kids are vastly different than those in school ten years ago, so NWEA™ conducts norming studies frequently—three to five years—ensuring that the comparisons reflect current standards and demographics. And we continually refine our best-in-class research model to make NWEA norms more accurate than any other—and always improving.
Norms help teachers teach and leaders lead
Norms help you see if students are growing at an expected pace, regardless of where a student started. NWEA norms allow you to make predictions about what kind of growth is typical and atypical.

Help you see your students’ percentile rankings in a nationally representative student population.
Allow you to compare your students’ growth with that of their academic peers.
Tests are not timed, and students may take as much time as they need to complete them (this eliminates some of the pressure and anxiety students may feel about taking tests). Most students take less than an hour to complete a MAP Growth test. MAP Growth K-2 tests are typically shorter.
Provide a context for comparing grade level achievement and growth in a single school relative to other schools across the nation. MAP Growth is the only interim assessment that provides school-level norms, helping you compare specific grade levels in your schools to students in the same grade across the nation.
A truly representative sample pool
NWEA uses anonymous assessment data from over 11 million students to create national norms, placing your students and schools within a representative national sample. By drawing from an incredibly wide pool of anonymized test records (pulled from millions of test events from over 24,500 public schools in 5,800 districts, spread across all 50 states), we’re able to accurately represent the US school-age population.
Unlock a world of potential with RIT
MAP® Growth™ measures student performance with our RIT scale—the most stable, mature scale in the industry. Like centimeters on a ruler, it measures in equal intervals, regardless of a student’s grade or performance—and it remains stable over time. This gives you an accurate measure of student performance, regardless of whether they’re performing on, above, or below grade level.
Why our teachers use RIT scores
Teachers use a student’s RIT score to:
- Identify common opportunity areas across an entire class
- Provide a starting point for high-quality formative assessment
- Inform instructional planning
- Help guide decisions about appropriate scaffolding strategies
- Track longitudinal growth over a student’s entire academic career
- Set growth goals with students
- Connect to instructional resources aligned to student RIT scores

Students know exactly what their goal is. You’ll have a kid run up and say ‘I hit my goal!’ They’re into it. They understand it and they know they’re getting better.
Dean Cunningham, Principal, Nenahnezad Community Schools, NM