Research report
COVID’s impact on science achievement: Trends from 2019 through 2024
September 2024

Description
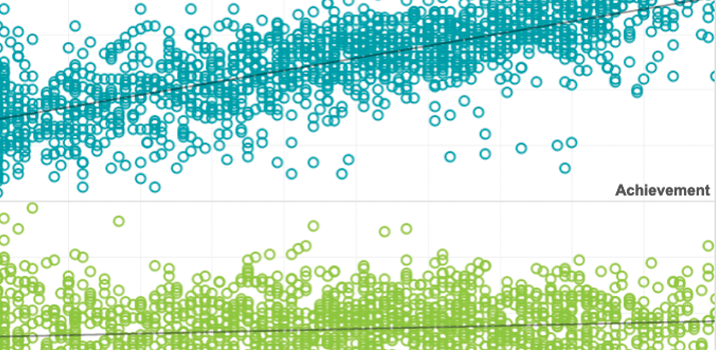
Building on NWEA’s previous research series focused on math and reading achievement, we now explore how the pandemic influenced student achievement in science. To our knowledge, this represents the first large-scale, in-depth analysis of how science achievement in the U.S.1 was influenced by the COVID-19 pandemic. As part of this study, our researchers examined science test scores across seven school years to understand how COVID-19 influenced science achievement.
See MoreTopics: COVID-19 & schools, Equity, Growth
Associated Research

Related Topics

Should kindergartners be redshirted? Costs likely outweigh academic benefits
This research brief examines the data on holding back five-year-olds from starting kindergarten – a practice known as redshirting. Using national data from over three million kindergartners from NWEA’s MAP Growth K-2 assessment, this study explores redshirting trends between fall 2017 and 2025. It also follows a kindergarten cohort (2021-22) through the third grade, examining whether there were academic advantages for redshirted students.
Products: MAP Growth
Topics: Early learning, Growth

Technical Appendix: Should kindergartners be redshirted? Costs likely outweigh academic benefits
This is the technical appendix for the research brief titled, “Should kindergartners be redshirted?” which examines the data on holding back five-year-olds from starting kindergarten – a practice known as redshirting.
Products: MAP Growth
Topics: Growth, Early learning

Kindergarten redshirting: What families should know
This is a family facing fact sheet about the data on the practice of delaying kindergarten, known as redshirting. Schools can use this fact sheet with families considering redshirting or who just want more information.
Products: MAP Growth
Topics: Early learning, Growth
Trend Snapshots: COVID-19 recovery in K–2, positive recovery trends
This short research brief highlights trends seen in the latest data released in the NWEA Map Growth National Dashboard. In this latest edition of Trend Snapshots, key findings focus on trends in K-2 academic recovery following the COVID pandemic.
Products: MAP Growth
Topics: COVID-19 & schools, Growth, Seasonal learning patterns & summer loss

From loss to recovery: Diverging paths and uneven gains across schools
This research brief examines two components of school recovery post-COVID pandemic to better understand recovery patterns. These include initial declines in average achievement and post-pandemic gains in average achievement across schools. By understanding these different recovery patterns, the brief offers insights to policy makers and leaders where to invest for long-term improvement and targeting support where it is needed most.
Topics: COVID-19 & schools, Growth, High-growth schools & practices, Seasonal learning patterns & summer loss

Tech Appendix for “From loss to recovery: Diverging paths and uneven gains across schools”
This is the technical appendix to the research brief titled, “From loss to recovery: Diverging paths and uneven gains across schools,” which examines two components of school recovery post-COVID pandemic to better understand recovery patterns.
Topics: COVID-19 & schools, Growth, High-growth schools & practices, Seasonal learning patterns & summer loss

Lessons in resilience: A playbook for recovery from natural disasters
This research brief is a follow-up report to NWEA’s brief examining the impact of extreme weather disruptions to teaching and learning. This report offers practical strategies and recommendations to school districts for preparing for extreme weather events to recover faster and lessen the impact on students and teachers.
Topics: COVID-19 & schools, Growth, Seasonal learning patterns & summer loss