Data visualization
Exploring the educational impacts of COVID-19
2023
By: Greg King

Description
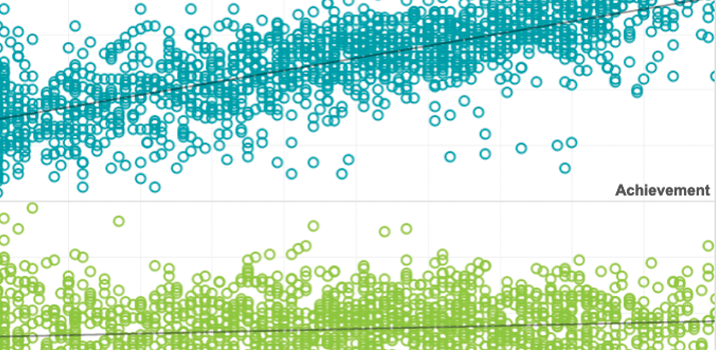
This visualization was developed to provide state-level insights into how students performed on MAP Growth in the 2020–2021 school year. Assessments are one indicator, among many, of the student impact from COVID-19. Our goal with this tool is to create visible data that informs academic recovery efforts that will be necessary in the 2022 school year and beyond.
See MoreAssociated Research
Related Topics


COVID’s impact on science achievement: Trends from 2019 through 2024
This new report examines the pandemic’s impacts on academic achievement and gain in Science and continues ongoing research by NWEA® analyzing the degree to which the COVID-19 pandemic, and its associated school closures, influenced student learning.
By: Susan Kowalski, Scott J. Peters, Megan Kuhfeld, Gustave Robinson, Karyn Lewis
Products: MAP Growth
Topics: COVID-19 & schools, Equity, Growth


Technical Brief – COVID’s impact on science achievement: Trends from 2019 through 2024
This is the accompanying technical brief to the new report (Covid’s impact on science achievement: Trends from 2019 through 2024) that examines the pandemic’s impacts on academic achievement and gain in Science and continues ongoing research by NWEA® analyzing the degree to which the COVID-19 pandemic, and its associated school closures, influenced student learning.
By: Susan Kowalski, Scott J. Peters, Megan Kuhfeld, Gustave Robinson, Karyn Lewis
Products: MAP Growth
Topics: COVID-19 & schools, Equity, Growth


Reconciling Recent Evidence on Academic Recovery in the US from 2022 to 2023
A new analysis comparing latest NWEA and the Education Recovery Scorecard results to understand pandemic recovery, so far, and look at differences and similarities in those results.
By: Dan Dewey, Megan Kuhfeld, Erin Fahle, Tom Kane, Sean F. Reardon
Products: MAP Growth
Topics: COVID-19 & schools, Equity, Growth


NWEA research report examining the impacts of the pandemic’s disruptions to learning and the status of academic recovery. This report features data from the 2023-24 academic year and underscores that unfinished learning continues to be a challenge due to lower achievement gains compared to pre-pandemic trends. This report is part of series tracking the on-going impacts.
By: Karyn Lewis, Megan Kuhfeld
Products: MAP Growth
Topics: COVID-19 & schools, Equity, Growth


NWEA research report examining the impacts of the pandemic’s disruptions to learning and the status of academic recovery. This report features data from the 2023-24 academic year and underscores that unfinished learning continues to be a challenge due to lower achievement gains compared to pre-pandemic trends. This report is part of series tracking the on-going impacts.
By: Karyn Lewis, Megan Kuhfeld
Products: MAP Growth
Topics: COVID-19 & schools, Equity, Growth


MAP Reading Fluency with Coach Evidence Base
This document provides an overview of the research underlying MAP Reading Fluency with Coach’s AI-powered intelligent reading tutor and the research on key elements of early literacy instruction. It describes the components of the MAP Reading Fluency with Coach pedagogy and the research base supporting each component.
By: Amy Endo
Products: MAP Reading Fluency
Topics: Early learning, Empowering educators, Innovations in reporting & assessment, Reading & language arts


Effective summer programs: Practical guidance for district leaders
This report dives into the research on summer programs, their implementation and design, as well as the efficacy of those programs for literacy, math, and social-emotional learning (SEL) outcomes. It also provides recommendations for district leaders to use as a framework for planning and implementing effective summer programming.
By: Miles Davison, Ayesha K. Hashim, Susan Kowalski, Jazmin Isaacs, Karyn Lewis, Sofia Postell, Michael Gaddis, PhD
Topics: COVID-19 & schools, Growth, Guidance, Seasonal learning patterns & summer loss


